Introduction
Ever since the suggestion of Popper and Mandel in 1937, that the clearance of endogenous creatinine approximates to the glomerular filtration rate (GFR), this test is traditionally considered the best overall index of renal function in health and disease. However, its performance and interpretation present some difficulties: variations in generation rate of creatinine, accurate measurement in plasma, some secretion by the renal tubules and finally the most important, the difficulty of obtaining complete, accurately timed urine collections1.
Several formulas have been developed to estimate creatinine clearance from creatinine concentration, age, sex, and body size2,3. Cockcroft and Gault formula is widely used to predict GFR, also others formula as creatinine clearance corrected to body size (CrClbs), and kt/v.
Recently in 1999, a new more accurate method to evaluate GFR was reported derived from a multicenter, controlled trial named Modified Diet in Renal Disease (MDRD) in which include gender, sex, age, and albumin4.
However there are limitations and the MDRD prediction equation requires validation in an independent population as elderly persons ( age > 70), diabetics, diabetics type 2 reciving insulin, younger people (age <18), pregnant women and patients with serious comorbid conditions (ICDE =3).
Our group, established a Advanced Chronic Renal Disease Unit (ACRDU) including patients with CLCr £
20 ml/min/1.73m2. Management and structure is discussed by Dra Barril in other issue inside of this round table.
MDRD prediction equation in older people5
We controlled 101 patients in our unit with demographic data showed in table I
Table 1
| |
Mean |
std |
|
Age |
69.48 |
13.49 |
|
icde |
2.16 |
1.02 |
|
KTVWK |
2.2481 |
.8780 |
|
MDRD |
15.3683 |
6.6442 |
|
GFR |
12.9616 |
5.3834 |
|
BMI |
26.3799 |
4.5474 |
|
CLCRSC |
18.5312 |
7.4903 |
55 female and 46 men, 26 (25.7%) were Diabetics (1+2). We used MDRD 7 equation and calculations were processed in a Excell worksheet, easy to use daily.
Laboratory determinations using Hitachi autoanalizer : BUN, serumand urine Cr, BUN urine 24 h collection, serum and urine Albumin. Kt/V was determinated by using Wattson volume formula. (MDRD7-FG) = 170 x Crp-0.999x Age-0.176 x (If Woman*0.762) x(1.18 Black race)x BUNs-0.17 x Alb 0.318
ClCrbs, Kt/V , CLCR C-G and MDRD were analized by multiple regression model.
The relationship of renal function measurements to other baseline characteristics was assessed by using contingency tables, t-tests, analysis of variance and linear regression, as appropiate.
We used stepwise multiple regression to determine a set of variables that predicted GFR
A P value less than 0.01 was considered statistically significant.
Table 2. Descriptive
|
|
Mean |
std |
N |
|
MDRD |
15.3734 |
6.7546 |
101 |
|
KTVWK |
2.2481 |
.8780 |
101 |
|
GFR |
13.1724 |
5.3419 |
101 |
|
CLCRSC |
18.5917 |
7.4768 |
101 |
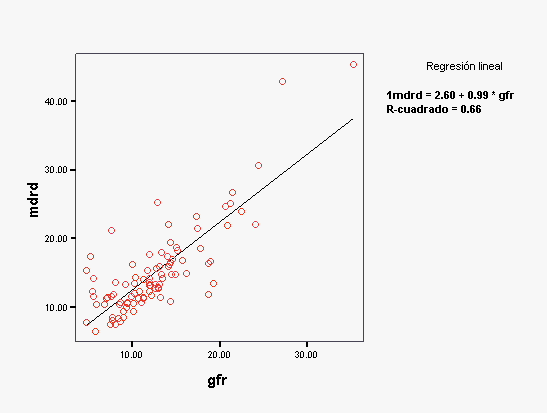
Table 3. Linear regression results: Relation to MDRD7-GFR
|
| Variable | Coef. Regression (ß) | P | R2 |
| ClCr SC | 0.83 | <0.01 | 0.71 |
| GFR C-G | 0.79 | <0.01 | 0.66 |
<0.01 | 0.60 |
Fig 1 : Linear regression MDRD-Kt/v
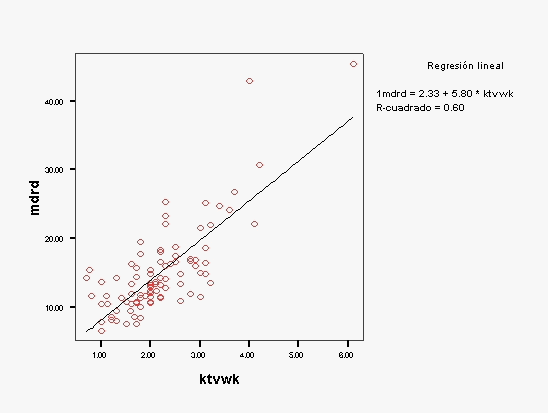
Fig 2 : Linear regression MDRD-CLCrbs
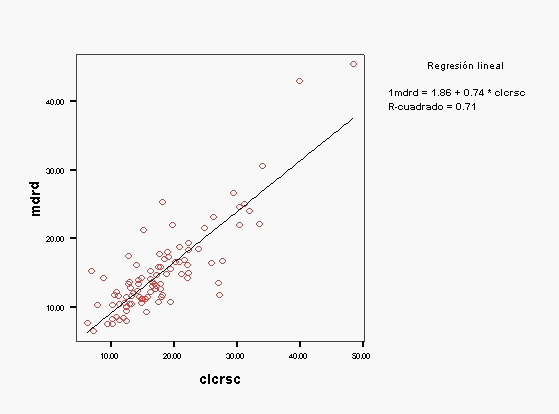
Fig 3 Linear regresión MDRD-CLCR C-G
The normal mean value and standard deviation for GFR in young adults are approximately 125 ±
20 ml/min/1.73m2. Normal aging is accompanied by reduction in GFR by approximately an average of 10 ml/min/1.73m2 per decade after age 40, so persons greater than age 70 may have a GFR < 90 ml/min/1.73m2. This decline is greater in hypertensive patients. Thus, a GFR between 60-90 ml/min/1.73m2 may be normal for older people.
In our population, included in ACRDU, we observed a good correlation with MDRD to estimate GFR, and it was useful to control patients in which was no possible to collect urine and also in patients with inaccurate 24h collection.
How MDRD works in elderly and diabetics patients6
Using the same protocol we analyze GFR in elderly and diabetics patients with CLCR< 20 ml/min/1.73m2
23 DIABETICS pts ( 1+2) ( 12 M, 11 W), Age: 71.09 ± 12.68 yr, ICDE : 2.57 ± 0.79
>Table 4 descriptive data
|
| | N | Min. | Max. | Mean ± DS |
CLCrSC | 26 | 6.10 | 29.9 | 18.5 ± 8.5 |
| MDRD7-GFR | 26 | 6.5 | 24.6 | 14.3 ± 4.5 |
| KT/V sem | 26 | 0.8 | 3.3 | 1.9 ± 0.7 |
| GFR | 26 | 4.8 | 23.2 | 11.9 ± 4.9 |
Table 5: Linear regression analysis: MDRD relationship
|
| Variable | Coef. Regresion (ß) | P | R2 |
| ClCr SC | 0.94 | <0.01 | 0.89 |
| FG Cr-G | 0.78 | <0.01 | 0.61 |
| Kt/V | 0.57 | <0.01 | 0.55 |
Fig 4 Linear Regression MDRD- Kt/v
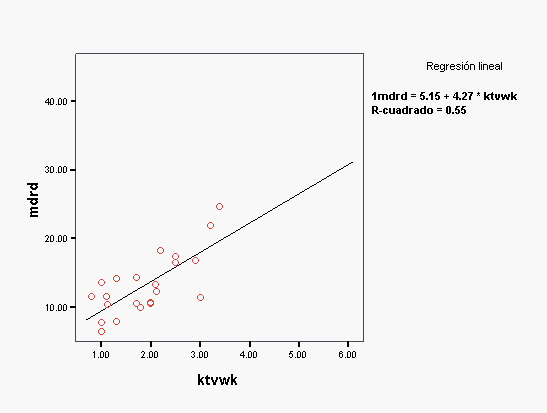
Fig 5: Linear regression MDRD-ClCrbs
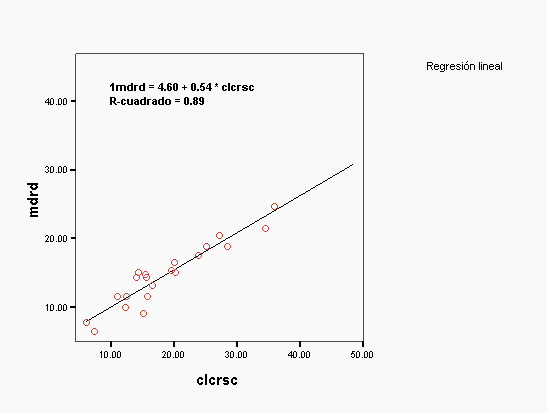
Fig 6 Linear regression MDRD- GFR Cr-G
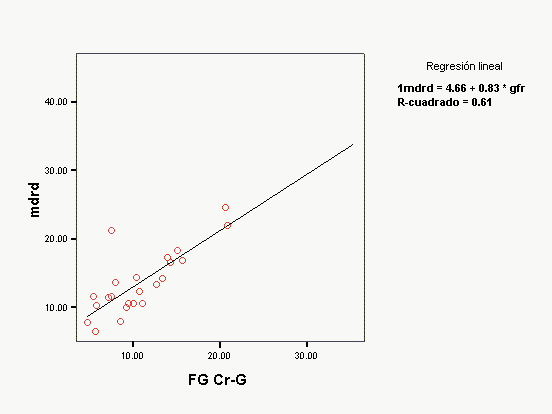
Fig 7: Comparison of equations to predict GFR7
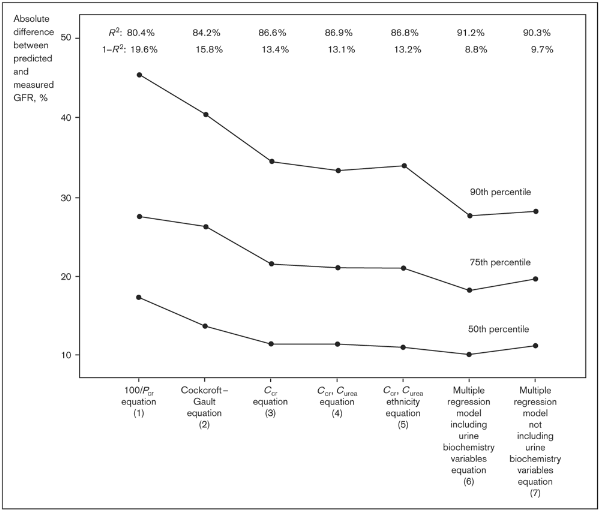
The MDRD study prediction equation offers several advantages over others equations. It appears more accurate than others equations, it is easy to perform in clinical practice as it can be computed with a few parameters. From our point of view, it does not require 24h urine collection or height and weight.This is important with patient that lose urine or have associated pathology making impossible collect urine. Predicts GFR rather than creatinine clearance and does so over a wide range of values, to follow the progression of renal disease7. Includes the ethnicity because chronic renal disease is more prevalent in blacks and now in our country this population is increasing.
Finally, GFR should not be assessed from serum creatinine only, others parameters should be included as age, gender, race and body size.
Criteria to start dialysis and follow up in advanced chronic renal disease will be discuss by others speakers in this same round table.


