Renovasculopathies and the rise of blood pressure with age.
RE Tracy, M.D.
Professor of Pathology
Louisiana State University Health Science Center
New Orleans LA USA
| DISCUSSION BOARD |
The rise of blood pressure with age in a population requires that a clock of some sort somewhere in the body must register the passage of time. Goldblatt proposed that microvascular lesions in the kidney can act as a clock whose face reads in units of blood pressure, mm Hg, incrementally added by aging. A wide range of evidence in support of this proposal comes from autopsies in human populations.
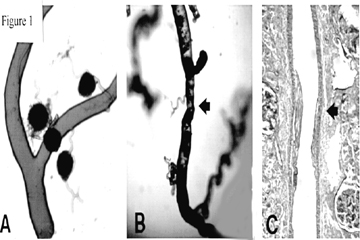
Casts of the arterial tree (Figure 1A,B), constructed by injecting plastic into the renal artery, offer a general sense of the distinctive vasculopathy that often accompanies essential hypertension. Hypertensive interlobular arteries exhibit strictures, in contrast with the smooth contour and uniform caliber of normal interlobular arteries [1]. Histologic sections reveal the kind of arterial feature that accounts for the appearance of strictures (Figure 2C). The medial layer of the arterial wall withers, to be replaced with an overgrowth of neointima composed of dense collagen in bulky layers with sparse cellularity. That arterial feature falls in the broad category of "arteriolosclerosis", a category that also includes arteriolar hyalinization and other loosely related entities. Precise quantitative inquiries call for a more specific name, and this report favors the term "renocortical arterial intimal fibroplasia" which shortens to "fibroplastic renovasculopathy". The name "hyaline renovasculopathy" is offered for the distinctive entity "renocortical arteriolar hyalinization".

Nephron heterogeneity
Aging introduces ever increasing quantities of renovascular fibroplasia [2,3], and this is apt to impart ever worsening strictures such as those in Figure 1. The effect of this hypothetical process would be to generate nephron heterogeneity. Some (ischemic) nephrons deprived of adequate blood flow would send out renin, thereby raising blood pressure. Other (hyperemic) nephrons, would suppress their own renin production, but would act to raise blood pressure by retaining salt and water in response to excessive renin from other sources. Seally et al [4] have elaborated the way that this uniquely disturbed setting, nephron heterogeneity, is peculiarly suited to sustaining both high and low renin forms of hypertension.
Renovasculopathy as a correlate of blood pressure
The pathological variable of central interest, as illustrated in Figure 1C, is the thickness of the fibroplastic neointima in renocortical arteries. The variable R = 100t/od reports the magnitude of the pathological intimal thickening, t, as a percentage of the outer diameter, od [5].
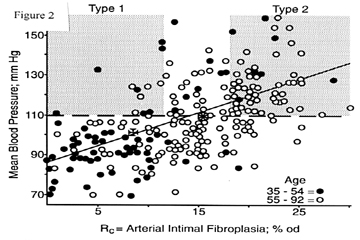
Figure 2 depicts some findings from a series of autopsies previously reported [5]. The hospital records of those subjects included numerous readings of blood pressure taken at outpatient visits. The mean blood pressure, derived from systolic (S) and diastolic (D) values by MBP = (S + 2D)/3, is used to avoid the effects of pulse pressure widening that accompanies stiffening of the aorta as it ages. Figure 2 makes use of MBP averaged over the most recent outpatient visits, thus avoiding large transitions from levels of the remote past, as explained elsewhere [6]. This series of cases is purposely overweighted with many hypertensive subjects because they are of special interest and because they often have the requisite lengthy records of blood pressure.

Each spot in Figure 2 represents an autopsy, dots for men and women of ages 35-54 years, and circles for ages 55-92 years. Maltese crosses depict the means of the two age groups. The sloping straight line is the regression line fit to all data (separate lines for the two age groups are rejected as statistically not significant). The horizontal line at the level of 110 mm Hg for MBP determines the arbitrarily chosen cutoff for defining "hypertension". This could represent S/D of 140/95, 150/90, 160/85 mm Hg or other values with variable pulse pressure that might be influenced by aortic stiffness.
Two types of benign essential hypertension
The grey zone labeled "Type 1" in Figure 2 represents the region of the chart that contains "hypertensive" subjects with mild or minimal fibroplastic renovasculopathy. The zone labeled "Type 2" represents "hypertensive" subjects with severe degrees of vasculopathy. Spots in the upper range between the grey zones can be viewed as showing both types of hypertension coexisting. Type 1 is a large vertical departure from the regression line. Type 2 is a large diagonal departure along the regression line.
Much evidence [7] tends to favor the view that Type 1 hypertension seldom if ever evolves into Type 2. By analogy with types 1 and 2 diabetes (insulin deficient and insulin resistant respectively), Type 1 is apt to be a wholly separate pathological entity without etiologic influence on Type 2 and vice versa. (To complete the analogy, the horizontal axis in Figure 2 could be labeled insulin resistance, the vertical axis blood glucose, and vertical departure from the regression line insulin deficiency; the dashed horizontal line is then the threshold for diabetes.)
Calculating blood pressure from renovasculopathy
The regession line in Figure 2 has the equation M = 1.7R + 86.6 mm Hg, where M refers to mean blood pressure in mm Hg and R is renovascular fibroplasia in units of %od. This tells us that each unit of %od corresponds to 1.7 mm Hg, and this is the increment of blood pressure elevation added by aging of interlobular arteries. This increment is added to a personalized "normal" level for each individual, a level which averages around 86.6 mm Hg in this group of subjects. If the personalized level is exceptionally high, then that by itself constitutes Type 1 hypertension. If the personalized level is average, then the 110 mm Hg threshold for hypertension is surpassed when R exceeds 14.2 %od. Notice that the formula acts to change the units of measure: vasculopathy is expressed in units of mm Hg blood pressure. (In practice, polynomial equations are used because they offer better precision for the peripheral parts of the scatter [8].)
Rise of blood pressure with age
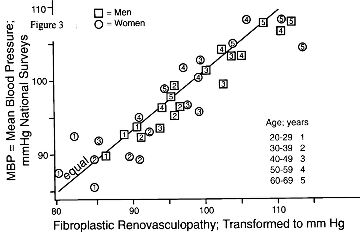
Autopsies do not provide a random sample of a living population. However, in the study of hypertension, a subset of autopsies can be selected so that the causes of death have no known correlation with hypertension or hypertension-linked cardiovascular diseases. These causes include violence, infectious diseases, cancers, and many other conditions. Autopsies in these basal categories offer an approximate representation of the living population [9]. Figure 3 gives results obtained from autopsies in such basal cases for men and women of USA (blacks and whites) [10], Tokyo, Japan [11], and for men of Bombay, India [8]. Fibroplastic renovasculopathy measured at autopsy is plotted on the horizontal axis, using units of measure transformed to mm Hg. Data on the vertical axis are drawn from published surveys in the USA [10], Japan [11], and India [8]. The dashed line in Figure 3 reproduces the regression line from Figure 2 to allow comparison of this line with the plotted data on population averages taken from other sources.
The group averages tend to cluster along the dashed diagonal line in Figure 3. This outcome has an interesting consequence: Variations along the diagonal are what define Type 2 hypertension, and this is the kind of variation that prevails between age groups. Vertical departures from the diagonal are what define Type 1 hypertension, and the small variations of that kind could be entirely due to background statistical errors. The kind of vertical variations between individuals seen in Figure 2 cancel each other when calculating group means, and those means, plotted in Figure 3, therefore fall near the diagonal. This is the expected outcome if Goldblatt's proposal is correct: fibroplastic renovasculopathy could be acting as a clock to register the passage of time, and displaying the consequences of aging in units of mm Hg to be incrementally added to each individual's personalized "normal" level.

Figure 3. MBP levels obtained by community
survey (vertical axis) are plotted against mean
values for fibroplastic renovasculopathy obtained
at autopsy in basal cases (horizontal axis with
units of measure changed into mm Hg MBP); data for
men and women of four populations within ten-year
age groups are included here. Sloping line
reproduces the regression line from Figure 2, and
was not derived from these data points.
Population comparisons
As detailed elsewhere [8], the data from Bombay fall near the lower left in Figure 3, New Orleans blacks form much of the upper right portion of the data scatter, while New Orleans whites and Tokyo are mostly intermediate. These distinctions are omitted in the Figure 3 to avoid cluttering the graph. Nevertheless, Figure 3 can serve to illustrate a dynamic image of how essential hypertension progresses: Starting at ages 20-29 years, data points fall near the lower left end of the dashed line. As the men and women of New Orleans grow older, their data points move upward and rightward along the dashed line, faster for the blacks than the whites. Subjects in Tokyo follow a similar trail to that of New Orleans whites. The men and women of Bombay progress more slowly; it takes them to ages 50-59 years before they overtake the New Orleans subjects of ages 30-39 years. This outcome implies that Type 2 hypertension, and not Type 1 hypertension, accounts for the rise of blood pressure with age at different rates in different populations.
Hyalinized arterioles
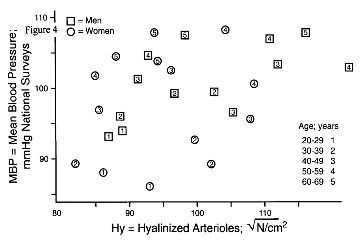
The close relationship of MBP to fibroplastic renovasculopathy, seen in Figure 3, is not reproduced by arteriolar hyalinization. Figure 4 was constructed as in Figure 3, substituting measurements of hyaline renovasculopathy for the fibroplastic form. Other authors have also noted the discordance of MBP with arteriolar hyalinization [2,12]. As noted elsewhere [5,13], hyalinization appears to have a strong association with atherosclerosis and coronary heart disease, but a weak relationship to hypertension.

Conclusions
Observations reviewed here offer reasons to suspect that nephron heterogeneity exists in the kidneys of most subjects with essential hypertension, and that this heterogeneity could be the source of high blood pressure in subjects with Type 2 hypertension. No practical test is available to detect nephron heterogeneity clinically. Tests for this purpose have not been and are not now in development. The reason for this deficiency is probably the general lack of suspicion for the existence of this pathological entity. Once the entity becomes the target of attention, it should not be difficult to devise a variety of tests for measuring its severity in clinical patients.
REFERENCES
1. Goldblatt H. The renal origin of hypertension. Physiol Rev 1947: 27:120-165.
2. Bell ET. Renal Diseases. Lea and Febiger, Philadelphia. 1950; pp 329-395.
3. Fishberg AM. Anatomic findings in essential hypertension. Arch Int Med 1925; 35:650-668.
4. Sealy JE, Blumenfeld JD, Bell GM, Pecker MS, Sommers SC, Laragh JH: On the renal basis for essential hypertension: Nephron heterogeneity with discordant renin secretion and sodium excretion causing a hypertensive vasoconstriction- volume relationship: J Hypertens 1988; 6:763-777.
5. Tracy RE: Blood pressure related separately to parenchymal fibrosis and vasculopathy of the kidney. Am J kid Dis 1992, 20:124-131.
6. Tracy, RE & Toca, VT. Nephrosclerosis and Blood Pressure: I. Rising and falling patterns in lengthy records. Laboratory Investigation 1974 30:20-29.
7. Tracy RE. The heterogeneity of vascular findings in the kidneys of patients with benign essential hypertension. Nephrol Dial Transplant 1999; 14:1634-39.
8. Tracy RE, Lanjewar DN, Ghorpade KG, Valand AG, Raghuwanshi SR. Renovasculopathies in elderly normotensives of Bombay, India. Geriat Nephrol Urol 1997; 7:101-109.
9. McFarlane MJ, Feinstein AR, Wells CK, Chan CK: The 'epidemiologic necropsy'. JAMA 1987; 258:331-338.
10. Tracy RE & Guileyardo JM. Renovasculopathies of hypertension in Hispanics of Dallas, Texas. Arch Med Res 1999; 30:40-8.
11. Tracy RE & Ishii T. Hypertensive renovasculopathies and the rise of blood pressure with age in Japan and USA. Geriat Nephrol Urol 1999; In Press.
12. Heptinstall RH. Hypertension I: Essential hypertension. Chapter 14. In: RH Heptinstall ed. Pathology of the Kidney. 4th ed. 1995; Boston: Little, Brown, & Co. 1995; 951-1028.
13. Tracy RE. Histologic characteristics of coronary artery in relation to the renovasculopathies of hypertension. Ann Diag Pathol. 1998; 2:159-66.