|
Discussion Board
Paneles de Discussión
Paneais de Discussio
Free Papers
Comunicaciones libres
Comunicaçoes livres
Home cin2003
Volver al Inicio cin2003
Voltar ao inicio cin2003
|
BONE "DENSITOMETRY": SO EASY TO ORDER, SO DIFFICULT TO INTERPRET
A. MICHAEL PARFITT M.D.
Professor of Medicine. Division of Endocrinology and Center for Osteoporosis and Metabolic Bone Disease,
University of Arkansas for Medical Sciences.
Little Rock, Arkansas. USA
parfittalwynm@uams.edu
Introduction and Background:
Fuller Albright divided metabolic disease into three categories 1 – osteitis fibrosa, osteomalacia and osteoporosis, in which normal bone removed during remodeling is replaced respectively by a mixture of woven bone and fibrous tissue, by unmineralized bone matrix or osteoid, or by a lesser quantity of normal bone 2. All nephrologists know that bone disease occurs in chronic renal failure, traditionally comprising various combinations of osteitis fibrosa and osteomalacia 3, but as the frequency of these disorders has diminished, the status of osteoporosis as a component of renal bone disease has engaged increasing attention 4. Historically, the skeleton in chronic renal failure was evaluated mainly by radiology 5 and less often by histology 4, but in general medical practice these diagnostic procedures have largely been replaced by bone densitometry 6; inevitably, the same has occurred in nephrology 7,8, even though the assumptions underlying the newer tool are less likely to be valid in patients with renal failure than in the general medical population.
Osteoporosis did not receive disproportionate emphasis from Albright, but is regarded by today’s physicians as virtually synonymous with metabolic bone disease; several factors, political as well as scientific, have contributed to this change in focus. First, bone loss is now recognized as a near universal accompaniment of aging, not confined to a small number of patients with a specific disease 9. Second, Albright restricted the diagnosis of osteoporosis almost exclusively to patients with vertebral compression fractures 1, but it became clear that fractures of long bones, especially the upper femur, were both more common and more important 10. Third, age related bone loss was shown to be a major cause of the age related increase in fracture risk 9,11. Fourth, organizations such as the American Society for Bone and Mineral Research promoted osteoporosis to the public, the medical profession, and the dispensers of research funds as the flagship disease of a new medical subspeciality 12. Fifth, strong commercial interests have encouraged redefinition of osteoporosis as a disease affecting most of the elderly population, including pharmaceutical companies wishing to increase the apparent need for medications and equipment manufacturers wishing to broaden the indications for complex and expensive diagnostic procedures.
Loss of bone with age was demonstrated by direct inspection 13 and by weighing of whole skeletal remains 14, but was first characterized in detail as a biologic process by radiographic morphometry of cortical thickness at several sites, most commonly the metacarpal 9,15. This simple method established the now well-known effects of growth, age, sex, race, heredity and disease 11, and allowed changes at the periosteal and endosteal envelopes to be separated, surface specificity lacking in most current methods. These are based on the absorption of energy transmitted in the form of either X-rays or photons by the crystalline mineral of bone, consisting mainly of calcium and phosphate ions and much smaller amounts of many others. About 80% of the energy absorption is by calcium, because of its higher atomic weight and greater abundance than phosphorous. Initially, only single energy instruments were available but dual energy methods allow more accurate correction for absorption by soft tissues 16. The basic assumption of all these methods is that the amount of mineral is a good estimate of the amount of bone, which is most accurately expressed as the volume of bone matrix 17. This is generally so because the ratio of mineral to matrix, or the degree of bone mineralization, normally varies between fairly narrow limits in the adult skeleton, with a coefficient of variation of about 10% 18.
Bone mineralization, density and mass:
Bone is formed in two stages; bone matrix is deposited first and replacement of water by mineral begins sometime later; the delay is about 15 days in the growing skeleton 19 and about 30 days in the adult skeleton 20. Bone also mineralizes in two stages. During primary mineralization, within a few hours or days is deposited about 70% of the maximum amount possible 17, which is defined by complete replacement of water, a process that requires osteoblasts. During secondary mineralization the next 25% is added at an exponentially decreasing rate; this process may take months or years and does not require osteoblasts, since for almost the whole duration of secondary mineralization the osteoblasts that made the bone being mineralized have been replaced by lining cells 21. The remaining 5% of maximum is never added provided live osteocytes remain 22; how osteocytes prevent the completion of mineralization in perilacunar bone is unknown, but after osteocyte death hypermineralization may make the bone more brittle 23. The extent of secondary mineralization depends on its kinetics, which are poorly understood, and on the local rate of bone turnover, which determines the age of the bone 24. If turnover is high, much bone is removed before the 95% value has been attained, but if turnover is very low, all the bone eventually attains the 95% value 18.
The methods for measuring bone mineral mass do not measure bone density, although regrettably they are so misdescribed by almost everybody who writes about them. In physics (and this is a branch of applied physics), density refers to mass per unit volume, with the same dimensions as concentration 16. Bone matrix has mass, but its contribution to density is generally ignored. If the volume is of the whole bone as an organ, the calculated density is referred to as apparent, since it is affected by different volumetric proportions of bone substance and marrow 25. If the volume is of cancellous bone tissue (including marrow), an apparent density may be calculated, analogous to the histologic measurement bone volume/tissue volume 4, but tissue density is a more precise term. If the volume is of bone substance only, for example a piece of bone from which all soft tissue has been removed, the calculated density is referred to as true 25. Apparent density diminishes substantially with age, but true density changes little with age; it may decrease slightly because of higher turnover 18, or increase slightly because of osteocyte death 23. Apparent density is a major determinant of whole bone strength 26, and true density is an important material property of bone 18, but at present these can only be measured in vitro, because there is no generally available method of measuring volume in vivo, either of a whole bone or of any anatomically defined compartment.
What is erroneously referred to as bone mineral density (BMD) is bone mineral mass partly normalized by a two-dimensional measurement of scanning extension, with results expressed as g/cm2. 16. In the radius one dimension is the width of the bone – an index of bone size, the other is 1 cm of bone length 27. In the vertebra, a software defined rectangle encloses a coronal (AP scan) or sagittal (lateral scan) section of the body and the projected area is calculated. In the upper femur several different regions of interest can be defined 16. The scanner measures energy absorption by all the mineral in the path of the beam; since this amount of mineral is roughly proportional to the distance traveled by the beam through the bone, bone mineral in g/cm2 inevitably increases with bone size 28 (Figure 1). In other words, what is called bone "density", sometimes referred to, in an attempt at greater precision of language, as areal density 16, overestimates apparent density in people with larger bones and underestimates apparent density in people with smaller bones.
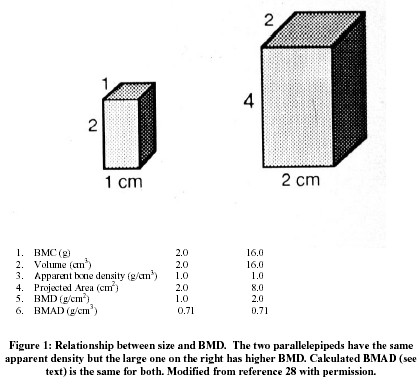 The relationship between bone mass and size is especially important during growth, since almost all of the 40 fold increase in mass between birth and maturity is due to bone enlargement 29, and bone mineral mass (or content – BMC) is a much better index of growth than BMD 30. Size also makes an independent contribution to bone strength 31, so that part of the increased fracture risk from a low BMD is mediated by smaller size. Determining the separate contributions of small size and low apparent density to a low BMD provide a better understanding of pathogenesis 32 even if fracture prediction is not improved 33. Furthermore, only apparent density and not size can be increased by treatment. In an attempt to address this issue BMC can be divided by projected area 3/2, which assumes that the unmeasured third dimension is equal to the geometric mean of height and width 28; the volume so calculated overestimates measured volume but is highly correlated with it 33. Combining a lateral with a PA scan 34 provides a more accurate estimate of volume 33. The quotient of BMC and calculated volume is designated, somewhat confusingly, bone mineral apparent density (BMAD; 28), which is a reasonable estimate of real apparent density as previously defined, but is not completely independent of bone size.
The structural basis of bone "densitometry":
Apparent density and its surrogate BMAD are properties of bones as organs, whose primary function is to resist the mechanical forces of muscle contraction and gravity 3,26. Although relevant to mechanical strength, apparent density ignores the distribution of bone substance within the bones. Cortical bone provides about three-quarters of the volume and mass in the peripheral skeleton, and about two-thirds in the central skeleton, carries most of the mechanical loads, and is where most fractures begin 35. The study of cortical bone had become unfashionable 3, but has recently been rehabilitated with recognition of the importance of the periosteum 36. Cancellous bone contributes to load bearing and in the central skeleton participates also in calcium homeostasis and the support of hematopiesis. Cortical bone contributes to the age related decline in BMAD in two ways, which are the opposite of what happens during growth. First, the cortices becomes thinner because the rate of net endocortical resorption exceeds the rate of net periosteal apposition 11,21.Nevertheless, because the contribution to strength increases with distance from the neutral axis, strength may be preserved even if BMAD falls 36. Second, the bone becomes more porous, partly because of an increase in bone turnover 4 and partly because of less complete refilling of resorption tunnels 21. In most, but not all 37 studies, thinning is quantitatively more important than porosity.
Cancellous bone also contributes to the age related decline in BMD in two ways. Although its three dimensional structure is highly complex, it is a convenient simplification to partition the total amount of cancellous bone into the number of trabeculae and their mean individual thickness 4,11. Trabecular number is determined by events during endochondral ossification and does not change during childhood and adolescence 19, but begins to fall soon after menopause because of increased depth of resorption by teams of osteoclasts, leading to perforation and removal of template 21. Trabecular thickness increases progressively during childhood and adolescence by about 4  m/y 19 and falls by about 1 m/y after age 50 because teams of osteoblasts make less bone than previously 11,21. The distinction between number and thickness has several implications 4. First, concerning pathogenesis loss of number is due to focally increased resorption but loss of thickness is due to focally decreased formation. Second, loss of number weakens the bone relatively more than the equivalent loss of thickness. Third, loss of number cannot at present be reversed but trabeculae can become thicker with anabolic therapy. Distinguishing between cortical and cancellous contributions to a fall in BMD is of etiologic importance because PTH excess causes relatively more loss of cortical bone 3,4 and glucocorticoid excess relatively more loss of cancellous bone 38. m/y 19 and falls by about 1 m/y after age 50 because teams of osteoblasts make less bone than previously 11,21. The distinction between number and thickness has several implications 4. First, concerning pathogenesis loss of number is due to focally increased resorption but loss of thickness is due to focally decreased formation. Second, loss of number weakens the bone relatively more than the equivalent loss of thickness. Third, loss of number cannot at present be reversed but trabeculae can become thicker with anabolic therapy. Distinguishing between cortical and cancellous contributions to a fall in BMD is of etiologic importance because PTH excess causes relatively more loss of cortical bone 3,4 and glucocorticoid excess relatively more loss of cancellous bone 38.
Superimposed on the structural changes that result from age related bone loss are additional structural consequences of renal bone disease. In the mild hyperparathyroidism of early renal failure there is nonspecific acceleration of cortical thinning, and increased cortical porosity due to increased turnover. But in severe hyperparathyroidism, there is osteitis fibrosa with replacement of resorbed bone by a combination of vascular fibrous tissue and woven, often metaplastic, bone 3-5. In woven bone, the collagen fibers are laid down randomly and lack the regular orientation found in lamellar bone 2, 17. Cancellization, instead of being restricted to the inner cortex 11,21, can occur throughout the cortex, leading to extensive reconstruction with woven bone, loss of normal cortico-medullary differentiation, and further reduction in the cortical contribution to BMAD. With replacement of lamellar cancellous bone by more loosely textured and often undermineralized woven bone BMAD may decrease, but more often it increases because of osseous metaplasia and osteosclerosis 3-5,39. The combination of subnormal BMAD in the peripheral skeleton (due to cortical thinning) and supernormal BMAD in the central skeleton (due to cancellous osteosclerosis) is characteristic of renal bone disease 3,5,9. In osteomalacia, the proportion of unmineralized matrix increases by about 10 fold on average, from about 0.5% to about 5% in iliac cortical bone and from about 2% to about 20% in iliac cancellous bone 40 with maximum values 2 to 3 times as high, but even so, thinning of cortical bone makes a larger contribution to the total loss of mineral 27,41.
The importance of bone turnover and remodeling:
The terms turnover and remodeling are often used interchangeably, but this is a mistake. Turnover is a kinetic term meaning fractional replacement, which in bone is usually expressed as %/yr. The reciprocal of turnover is mean lifespan, which approximately equals twice mean age 24, 42. Remodeling is the cellular mechanism that accomplishes turnover in the adult skeleton; in the growing skeleton turnover is accomplished mainly by modeling rather than remodeling 21. Remodeling is carried out by temporary anatomic structures known as basic multicellular units (BMU), in which a quantity of old bone is removed from specific locations by a team of osteoclasts, and replaced at the same location by a team of osteoblasts. Within each BMU resorption lasts for about four weeks, the switch-over from resorption to formation for about two weeks and formation for about 24 weeks 20. Remodeling is episodic - a new episode begins at any surface location every 2-3 years; the average number of new episodes per year is referred to as activation frequency 21. During modeling, resorption and formation occur simultaneously on different surfaces for several years as the bones elongate and enlarge 21; their coupling is systemic, rather than local, as it must be within the BMU 43.
The relationship between bone turnover, bone age, and bone mineral density, briefly summarized earlier, is one aspect of a more general phenomenon - the bone remodeling transient 44. During the replacement of bone by remodeling there is a time interval of approximately six months between the completion of bone resorption at a particular surface location and the completion of bone formation at the same location 20. The aggregate of temporarily missing bone is referred to as the remodeling space; additional temporarily missing bone mineral is represented by osteoid, which is newly deposited bone matrix that has not yet mineralized, and by incompletely mineralized new bone previously referred to. The sum of these three components comprises the total reversible mineral deficit (RMD; 45, which in a skeleton of normal size (1000 g Ca in a woman) and a turnover of normal rate (about 10%/y), is about 30-40 g of calcium, or about 3-4% of total body calcium 44.
Each BMU makes its own contribution to the RMD, since within each BMU there are sequential increases in the volume of missing bone, the volume of unmineralized osteoid, and the volume of incompletely mineralized new bone. The total RMD is the aggregate of the contributions of all the BMU’s present at one time, consequently the more BMU’s there are, the higher the RMD. Although BMU lifespan can change, more important are changes in birth rate, so that the total RMD is governed mainly by, and is roughly proportional to, the activation frequency averaged over the whole skeleton. Furthermore, the local RMD depends on the local rate of turnover, which is greatest in the spine, least in the forearm, and intermediate in the upper femur 46. If any component of the RMD increases for any reason, there will be a corresponding fall in BMC, BMD and BMAD. Conversely, if any component decreases, there will be a corresponding rise in BMC, BMD and BMAD 44. The volume of osteoid increases substantially in osteomalacia; the corresponding fall in BMC and BMD is inferred from the large increases that occur with treatment 47. The onset of bone formation within each BMU is delayed by glucocorticoid excess 38, with a corresponding increase in remodeling space, but the largest changes in RMD are brought about by changes in activation frequency and bone turnover 44,45(Figure 2).
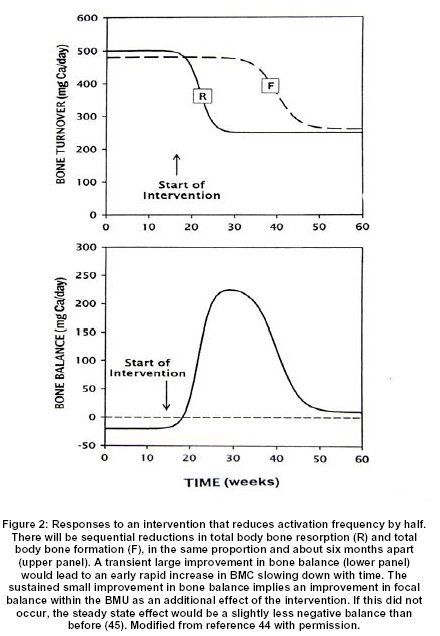
A sustained increase in activation frequency to a new higher level will lead over a period of about six months to a gradual one time increase in RMD to a proportionately higher new level, and a corresponding one time decrease in BMAD. In addition, the existing rate of change in BMAD, whether negative or positive, will be amplified in the same proportion. Conversely, a sustained decrease in activation frequency to a new lower level will similarly decrease RMD and increase BMAD and attenuate any existing rate of change 44,45. This single mechanism accounts for most of the rapid loss of BMD that follows menopause 48, because estrogen deficiency increases activation frequency 11,21 and for most of the rapid gain of BMD that follows successful parathyroid surgery 46, because a fall in parathyroid hormone (PTH) secretion decreases activation frequency 4,21. Furthermore, the local gain will be related to the local rate of turnover 46 and so will be greatest in the spine, least in the forearm and intermediate in the upper femur 49. The same mechanism accounts for the early rapid increase in BMD, slowing down with time, in response to so called anti-resorptive therapy 45,50, since all currently available medications that are so described produce most of their effects by reducing activation frequency 11,21.
Bone "densitometry" in nephrologic practice:
In general medical and endocrine practice bone densitometry is used to estimate fracture risk, as a basis for therapeutic decisions concerning fracture prevention 6. Many factors contribute to fracture pathogenesis 11, but the most robust predictor is BMD 6, which is the most widely used surrogate for BMAD (which itself is a surrogate for real apparent density). A low BMD at any site increases the risk of fracture at any site, but in general the increase in risk is greatest at the measured site. It is useful to compare a patient’s BMD value with a sex and race specific reference range in two ways 2. The T score - the deviation from the mean peak adult value in standard deviation (SD) units – estimates how much bone has been lost (or never gained). The Z score – the deviation from the age, sex and race specific mean value in SD units – estimates the likelihood that factors additional to age related bone loss (such as renal bone disease) have contributed to the observed value. BMD and fracture risk are continuous variables but for largely non-scientific reasons arbitrary cut off points have been proposed by the WHO 51 and uncritically accepted by many in the field. "Osteoporosis" is defined as a T-score of < -2.5, "osteopenia" (which literally means too few bones!) is defined as a T-score between –1 and –2.5, and "normal" is defined as a T-score between –1 and +2 6. Although group fracture risk differs between these categories, an individual’s fracture risk is more accurately conveyed by the individual value than by the category 11.
In otherwise healthy persons concerned about fracture prevention, the basic assumption of bone densitometry, that a low BMD is a reliable index of bone matrix deficiency (within the 10% coefficient of variation), is reasonable, because the likelihood of conditions that could disrupt the relationship between matrix and mineral is remote. The same assumption underlies the calculation of T and Z-scores and the assignment to WHO defined categories. In patients with renal bone disease, however, this assumption is obviously quite unreasonable, because a low BMD could reflect the accumulation of unmineralized osteoid or incompletely mineralized woven bone 3,4, and the usual relationship between BMD and bone strength 26 may no longer hold 3. Furthermore, vertebral BMD could be normal because bodies with above normal density are superimposed on appendages with below normal density, concealing the most distinctive structural features 3. In patients with so called adynamic bone disease, who have very low bone turnover because of oversuppression of PTH secretion 4, femoral BMD could be normal even if bone matrix volume is reduced, because of over mineralization 18.
Predictably the results have been quite variable, with high, normal and low mean BMD values reported in different series 3. The most consistent finding has been a wide scatter of results, with higher than normal proportions of both high and low individual values 3. Quantitative computed tomography, which can measure apparent (tissue) density in a small cube of cancellous bone in the center of a vertebral body, is the only form of densitometry giving results in agreement with those of bone histology, with increased values in patients with osteitis fibrosa and decreased values in patients with osteomalacia 3. Regrettably, several authors have reported BMD values, T-scores and WHO categories in patients with renal failure, mistakenly assuming that these numbers have the same structural significance as in patients with normal renal function 52-55. Not surprisingly, neither spinal nor femoral BMD is able to predict fracture 55,56, although radial BMD remains useful for this purpose 57, 58.
Despite these difficulties, it is important to try and identify patients who need the same measures to preserve bone matrix and reduce fracture risk as those with normal renal function 7,59-62. DEXA of the spine may be misleading in the elderly 6, is even less reliable in renal patients, and should not be used at all. The peripheral skeleton is less affected by osteitis fibrosa and osteomalacia than the central skeleton; a low radial BMD is usually due to cortical thinning, is the best index of the adverse skeletal effects of excess PTH 4,46 and should also capture the effects of estrogen deficiency and aging on cortical bone. DEXA of the upper femur is most often reduced in renal patients 3,4 but is more difficult to interpret; the supposedly normal femoral BMD in early renal failure 63 probably reflected inappropriate "adjustment" for body weight. It is impractical to do a bone biopsy on every patient, but this should not prevent nephrologists from thinking about the possible significance of a low femoral BMD in every patient; even in those with normal renal function, a low BMD should be the starting point and not the end of the process of differential diagnosis 64. T and Z scores may be descriptively useful, but because of their misleading pathologic and diagnostic implications, WHO categories should not be assigned 61. It is essential to always consider the effects of bone size and of the RMD on a BMD value.
But the greatest need is to develop a reliable index of bone resorption, based on the serum level of a substance that is not cleared by the kidney, of which the concentration is unaffected by renal function. An increased value of such an index with a normal level of true PTH 4 would be a more reliable guide to the need for a bisphosphonate 65 or for low dose or transdermal estrogen 60 than any form of bone densitometry. In this way bone matrix could be preserved and at least some fractures prevented in patients with renal failure, even without securing agreement on precisely how "osteoporosis" should be "diagnosed" 11.
REFERENCES:
- Albright F, Reifenstein EC. The Parathyroid Glands and Metabolic Bone Disease. 1948. Baltimore. Williams and Wilkins.
- Parfitt AM, Duncan H. Metabolic bone disease affecting the spine. In: Rothman R, Simeone F, eds. The Spine, 2nd ed. Philadelphia, WB Saunders, 1982:775-905.
- Parfitt AM. Perspective: A structural approach to renal bone disease. J Bone Miner Res, 1998. 13: 1213-1220.
- Parfitt AM. Renal bone disease: a new conceptual framework for the interpretation of bone histomorphometry. Curr Opin Nephrol Hypertens 2003; 12:387-408.
- Parfitt AM. The clinical and radiographic manifestations of renal osteodystrophy. In: David DJ, ed. Perspectives in Hypertension and Nephrology: Calcium Metabolism in Renal Failure and Nephrolithiasis. J Wiley, 1977:145-195.
- Kleerekoper M. Evaluation of the Patient with Osteoporosis or at Risk for Osteoporosis. In: Marcus R, Feldman D, Kelsey J, eds. Osteoporosis, 2nd ed. Academic Press. 2001. 2:403-409.
- Lindberg JS, Moe SM. Nephrology-Specific Issues in Women’s Health. Osteoporosis in End-Stage Renal Disease. Seminars in Nephrology. 1999. 19:115-122.
- Elder G. Pathophysiology and Recent Advances in the Management of Renal Osteodystrophy. J. Bone Miner Res 2002; 17:2094-2105.
- Morgan B. Osteomalacia Renal Osteodystrophy and Osteoporosis. Charles C. Thomas, Springfield, Illinois. 1973.
- Melton L. Epidemiology of fractures. In: Osteoporosis: Etiology, Diagnosis and Management, 1988; 133-154. Edited BL Riggs & L Melton, New York Raven Press.
- Parfitt AM. Osteoporosis: 50 years of change, mostly in the right direction. In: Compston J, Ralston S, eds. Osteoporosis and Bone Biology: The State of the Art. International Medical Press, London. 2000m 1-13.
- Melton LJ, Chrischilles EA, Cooper C, Lane AW, Riggs BJ. Perspective. How many women have osteoporosis? J. Bone Miner Res. 1992; 7:1005-1010.
- Cooper SA. Treatise on Dislocations and on Fractures of the joints. 4th edn. 1824. London; Longman.
- Trotter M, Broman GE, Peterson RR. Densities of bones of white and negro skeletons. J.Bone Jt. Surg 1960. 42-A, 50-58.
- Gam SM. The Earlier Gain and Later Loss of Cortical Bone in Nutritional Perspective. 1970. Springfield: CC Thomas.
- Faulkner KG. Clinical Use of Bone Densitometry. In: In: Marcus R, Feldman D, Kelsey J, eds. Osteoporosis, 2nd ed. Academic Press. 2001. 2:433-458.
- Frost HM. Bone Remodeling Dynamics. 1963. CC Thomas, Springfield, Illinois.
- Boivin G, Meunier PJ. The Degree of Mineralization of Bone Tissue Measured by Computerized Quantitative Contact Microradiography. Calcif Tissue Int. 2002; 70:503-511.
- Parfitt AM, Travers R, Rauch F, Glorieux FH. Structural and Cellular Changes During Bone Growth in Healthy Children. Bone 27:487-494, 2000.
- Parfitt AM, Han Z-H, Palnitkar S, Rao DS, Shih M-S, Nelson D. Effects of ethnicity and age or menopause on osteoblast function, bone mineralization and osteoid accumulation in iliac bone. J Bone Min Res, 1997;12:1864-1872.
- Parfitt AM. Modeling and Remodeling: How Bone cells Work Together. In: Feldman D, Glorieux F, Pike W (eds). Vitamin D. San Diego CA, Academic Press, Inc. 2nd Ed.
- Frost HM. In vivo osteocyte death. J Bone Jt Surg. 1960; 3 42-A:128-143.
- Frost HM. Micropetrosis. J Bone Jt Surg 1960. 42-A: 144-150.
- Parfitt AM, Kleerekoper M, Villanueva AR. Increased bone age: Mechanisms and consequences. In: Christiansen C, Johansen C, Riis BJ, eds. Osteoporosis 1987. Osteopress ApS, Copenhagen, pp. 301-308.
- Parfitt AM. The composition, structure and remodeling of bone: A basis for the interpretation of bone mineral measurements. In: Dequeker J, Geusens P, Wahner HW, eds. Bone Mineral Measurements by Photon Absorptiometry: Methodological Problems. Leuven University Press, Leuven, 1988, pp 9-28.
- Bouxsein ML. Biomechanics of Age-Related Fractures. In: Marcus R, Feldman D, Kelsey J, eds. Osteoporosis, 2nd ed. Academic Press. 2001. 2:509-531.
- Parfitt AM, Rao DS, Stanciu J, Villanueva AR, Kleerekoper M, Frame B. Irreversible bone loss in osteomalacia: Comparison of radial photon absorptiometry with iliac bone histomorphometry during treatment. J Clin Invest 1985;76:2403-2412.
- Carter DR, Bouxsein ML, Marcus R. New approach for interpreting projected bone densitometry data. J Bone Min Res. 1992; 7:137-145.
- Parfitt AM. Genetic effects on bone mass and turnover-relevance to black/white differences. J Amer Coll Nutr, 1997; 16:325-333.
- Heaney RP. Bone mineral content, not bone mineral density, is the correct bone measure for growth studies. Am J Clin Nutri. 2003. 78:350-351.
- Duan Y, Parfitt AM, Seeman E. Vertebral Bone Mass, Size and Volumetric Density in Women with Spinal Fractures. J. Bone Min Res 1999; 14:1796-1802.
- Tabensky A, Duan Y, Edmonds J, Seeman E. The contribution of reduced peak accrual of bone and age-related bone loss to osteoporosis at the spine and hip: insights from the daughters of women with vertebral or hip fractures. J Bone Min Res. 2001; 16:1101-1107.
- Tabensky AD, Williams J, DeLuca V, Briganti E, Seeman E. Bone mass, areal, and volumetric bone density are equally accurate, sensitive, and specific surrogates of the breaking strength of the vertebral body: an in vitro study. J Bone Min Res. 1996;11:1981-1988.
- Peel NFA, Eastell R. Diagnostic Value of Estimated Volumetric Bone Mineral Density of the Lumbar Spine in Osteoporosis. J Bone Min Res. 1194;9:317-
- Ferretti JL, Frost HM, Gassier JA, High WB, Jee WS, Isrema C, Mosekide L, and Thompson DD. Perspective on osteoporosis research: In focus and some insights from a new paradigm. Calcif Tiss Int. 1995; 57:399-404.
- Seeman E. Periosteal Bone Formation – A neglected Determinant of Bone Strength. N. Engl J Med. 2003. 348:320-323.
- Ahlborg HG, Johnell O, Turner CH, Rannevik G, Karlsson MK. Bone Loss and Bone Size after Menopause. N Egnl J Med. 2003. 349:327-334.
- Weinstein RS. Glucocorticoid-induced osteoporosis. Reviews in Endocrine & Metabolic Disorders. 2001. 2:65-73.
- Weinstein RS, Sappington LJ. Qualitative bone defect in uremic osteosclerosis. Metabolism: Clinical & Experimental. 1982. 31:805-811.
- Parfitt AM. Bone fragility in osteomalacia: Mechanisms and consequences. In: Uhthoff H, Jaworski ZFG, eds. Current Concepts of Bone Fragility. Berlin Heidelberg, Springer-Verlag, 1986:265-270.
- Schober H-C, Han Z-H, Foldes AJ, Shin M-S, Rao DS, Balena F, Parfitt AM. Mineralized bone loss at different sites in dialysis patients: implications for prevention. J Amer Soc Nephrol 1998. 9: 1225-1233.
- Parfitt AM. Misconceptions (2), Bone Turnover is always higher in cancellous than in cortical bone. Bone. 2002; 30:807-809.
- Parfitt AM. Mini-Review-The Mechanism of Coupling – A role for the vasculature. Bone. 2000; 26:319-323.
- Heaney RP. The Bone Remodeling Transient: Interpreting Interventions Involving Bone-related Nutrients. Special Article: Methods in Nutrition Science, Nutrition Review 59. 2001. 327-333.
- Parfitt AM. Morphologic basis of bone mineral measurements. Transient and steady state effects of treatment in osteoporosis. Editorial, Mineral Electrolyte Metab 1980;4:273-287.
- Rao DS, Wallace EA, Antonelli RF, Talpos GB, Ansari MR, Jacobsen G, Divine GW, Parfitt AM. Forearm Bone Density in Primary Hyperparathyroidism: Long Term Follow-up With and Without Parathyroidectomy. Clin Endocr. 2003. 58:348-354.
- Basha B, Rao DS, Han Z-H, Parfitt AM. Osteomalacia due to Vitamin D Depletion in Patients with Gastrointestinal Disorders. Amer.J.Med. 108:296-300. 2000.
- Heaney RP. The bone remodeling transient: implications for the interpretation of clinical studies of bone mass change. J Bone Miner Res. 1994; 9:115-1523.
- Silverberg SJ, Shane E. Jacobs TP, SM ED. Bilezikian JP. A 10-year prospective study of primary hyperparathyroidism with or without parathyroid surgery. New England Journal of Medicine. 1999. 341:1249-1255.
- Heaney RP, Yates AJ, Santora AC II. Bisphosphonate effects and the bone remodeling transient, J. Bone Miner Res. 1997; 12:143-1151.
- Kanis JA. Assessment of fracture risk and its application to screening for postmenopausal osteoporosis: synopsis of a WHO report. WHO Study Group. Osteoporos Int 1994; 4:368-381.
- Stehman-Breen CO, Sherrard D, Walker A, Sadler R, Alem A, Lindberg J. Racial Differences in Bone Mineral Density and Bone Loss Among End-Stage Renal Disease Patients. Amer J Kidney Dis. 1999; 33:941-946.
- Taal MW, Masud T, Green D, Cassidy MJD. Risk factors for reduced bone density in haemodialysis patients. Nephrol Dial Transplant. 1999. 14:1922-1928.
- Roe S, Cassidy MJD. Diagnosis and monitoring of renal osteodystrophy. Current Opinion in Nephrology & Hypertension. 2000. 9:675-681.
- Jamal SA, Chase C, Goh YI, Richardson R, Hawker GA. Bone Density and Heel Ultrasound Testing do Not Identify Patients with Dialysis-Dependent Renal Failure Who Have Had Fractures. Amer J Kidney Dis. 2002. 39:843-849.
- Erlichman M, Holohan TV. Bone densitometry: patients with end-stage renal disease. Health Tech. Assessment 8. 1996; 1-27.
- Yamaguchi T, Kanno E, Tsubota J, Shiomi T, Nakai M, Hattori S. Retrospective Study on the Usefulness of Radius and Lumbar Bone Density in the Separation of Hemodialysis Patients with Fractures from Those Without Fractures. Bone. 1996; 19:549-555.
- Kaji H, Suzuki M, Yano S, Sugimoto T, Chihara K, Hattori S, Sekita K. Risk factors for hip fracture in hemodialysis patients. Amer J Nephrol. 2002. 22:325-331.
- Ott SM. Does estrogen play a role in renal osteodystrophy? Semin Dial. 1995. 8:4-11.
- Matuszkiewicz-Rowinska J, Skorzewska K, Radowicki S, Sokalski A, Przedlacki J, Niemczyk S, Wlodarczyk D, Puka J, Switalski M. The benefits of hormone replacement therapy in pre-menopausal women with oestrogen deficiency on haemodialysis. Nephrol Dialysis Transp. 1999. 14:1238-1243.
- Hodsman AB. Fragility Fractures in Dialysis and Transplant Patients. Is it osteoporosis, and how should it be treated? Peritoneal Dialysis International. 2001; 21:S247-S255.
- Weisinger JR, Bellorin-Font E. Postmenopausal Osteoporosis in the dialysis patient. Current Opinion in Nephrology and Hypertension. 2003. 12:381-386.
- Hsu C, Cummings SR, McCulloch CE, Chertow GM. Bone mineral density is not diminished by mild to moderate chronic renal insufficiency. Kidney Int’l. 2002. 61:1814-1820.
- Paterson CR, Mole PA, Wilson SJ. Osteopenia has a differential diagnosis. Scot Med J. 2001. 46:163-164.
- Fan SLS, Cunningham J. Bisphosphonates in renal osteodystrophy. Current Opinion in Nephrology and Hypertension. 2001. 10:581-588.
|