|
Paneles de Discussión
Paneais |
Free Papers / Comunicaciones libres/ Comunicaçoes livres
PERITONITIS RATES, ADEQUACY AND SURVIVAL IN CONTINUOUS AMBULATORY (CAPD) AND AUTOMATED PERITONEAL DIALYSIS (APD) PATIENTS.Locatelli A, Marcos G, Alvarez S, Gómez M, De Benedetti L, Verón D.Nefrología Olivos. Buenos Aires, Argentinagmarcos1@hotmail.comABSTRACTObjective: Data comparing peritonitis (P),adequacy and survival(S) in CAPD versus APD patients (ps) are controversial.The aim of this study is to compare S, adequacy, P rates and the etiologic organisms of infection in two groups of ps undergoing CAPD and APD in a single center during a 42-month (mo) period.
Patients and Methods: We studied 44 incident ps, with at least 3 mo on peritoneal dialysis, starting therapy in our programm between january 1999 to july 2002, 25 of them on CAPD (age 54 ,range18-81 yr ,14 females,11 males) and 19 on APD using Baxter Home Choice® cyclers (age 50,range 34-73; 10 females,9 males). Etiology: CAPD: DBT 16%, GN 28%, APKD 16%, SLE 4%, Interstitial nephritis(IN) 8%, unknown 28%; APD: DBT 26,3%, GN 26,3%, APKD 5,3%, SLE 10,5%, IN 10,5%, unknown 21%.
Results: Time on therapy: CAPD 14(3-32), APD 13(3-28)mo. P incidence: CAPD 59,56 and APD 49,85 ep/p/mo (p<0.88). P microrganisms obtained: CAPD gram-pos 60%,gram-neg 40% and APD gram-pos 50%, gram-neg 25%,Fungus 25%. Adequacy: wpCrCl :CAPD 54,4 ± 12,4 L and APD 57,1 ± 15,5 L (p<0,53); wpKTV: CAPD 2.0 ± 1,79 and APD 1.92 ± 0,39 L (p<0,84). Survival: CAPD 66% at 32 mo ,APD 72 % at 28 mo. Conclusions:
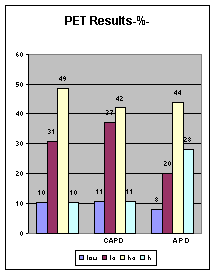
2) Gram-positive bacteria were predominant in both groups 3) No differences in adequacy and survival were found in both groups in the period studied. Automated peritoneal dialysis is accepted as a form of renal replacement for patients with end-stage renal disease and peritonitis is still a mayor complication of peritoneal dialysis. In our country we have 6 year experience with this treatment. Data comparing peritonitis (P), adequacy and survival (S) in CAPD versus APD patients (ps) are controversial so the aim of this study is to compare S, adequacy, P rates and the etiologic organisms of infection in two groups of ps undergoing CAPD and APD in a single center during a 42-month (mo) period. Patients and Methods: We studied 44 incident ps, with at least 3 mo on peritoneal dialysis, starting therapy in our programm between january 1999 to july 2002, 25 of them on CAPD (age 54, range18-81 yr, 14 females, 11 males) and 19 on APD using Baxter Home Choice® cyclers (Baxter Healthcare Corporation) with average age 50 years old, range 34-73; 10 females, 9 males. A peritoneal equilibration test was performed at least 60 days after peritoneal dialysis was begining.(table 1) TABLE 1

Diagnoses included:
CAPD: APD:
We compared survival (technique drop-out and death), the incidence of P, their causal organisms, weekly peritoneal Creatinine clearance (wpCrCl) and KT/Vurea (wpKTV), between the two modes of therapy.
Results:
There is not difference between:
2) hiperparatirodism: APD pthi 518 CAPD pthi 470 - p<0.70. 3) nutrition: APD: albumin 3.58 CAPD albumin 3.55 - p<0.68 We found difference with hyperlidaemia values: APD 255.95 and CAPD 182.4-p<0.003.
wpKTV: CAPD 2.0 ± 1,79 and APD 1.92 ± 0,39 L (p<0,84). Survival:
APD 72 % at 28 mo. Conclusions:
2) Gram-positive bacteria were predominant in both groups 3) No differences in adequacy and survival were found in both groups in the period studied. |